Make the most out of your software

Understand Your Business Like Never Before

Dashboards by API is a complete, ready-to-use solution built specifically for trade business owners who want to grow their business through data-informed decisions. Unlike generic reporting tools, it helps you unlock more value from the systems you already use by transforming data into clear and actionable insights, with no need for manual analysis, spreadsheets, or guesswork.

Powerful Features Designed for Trade Business Growth

Hover or tap the cards for more info!

Profit Per Hour

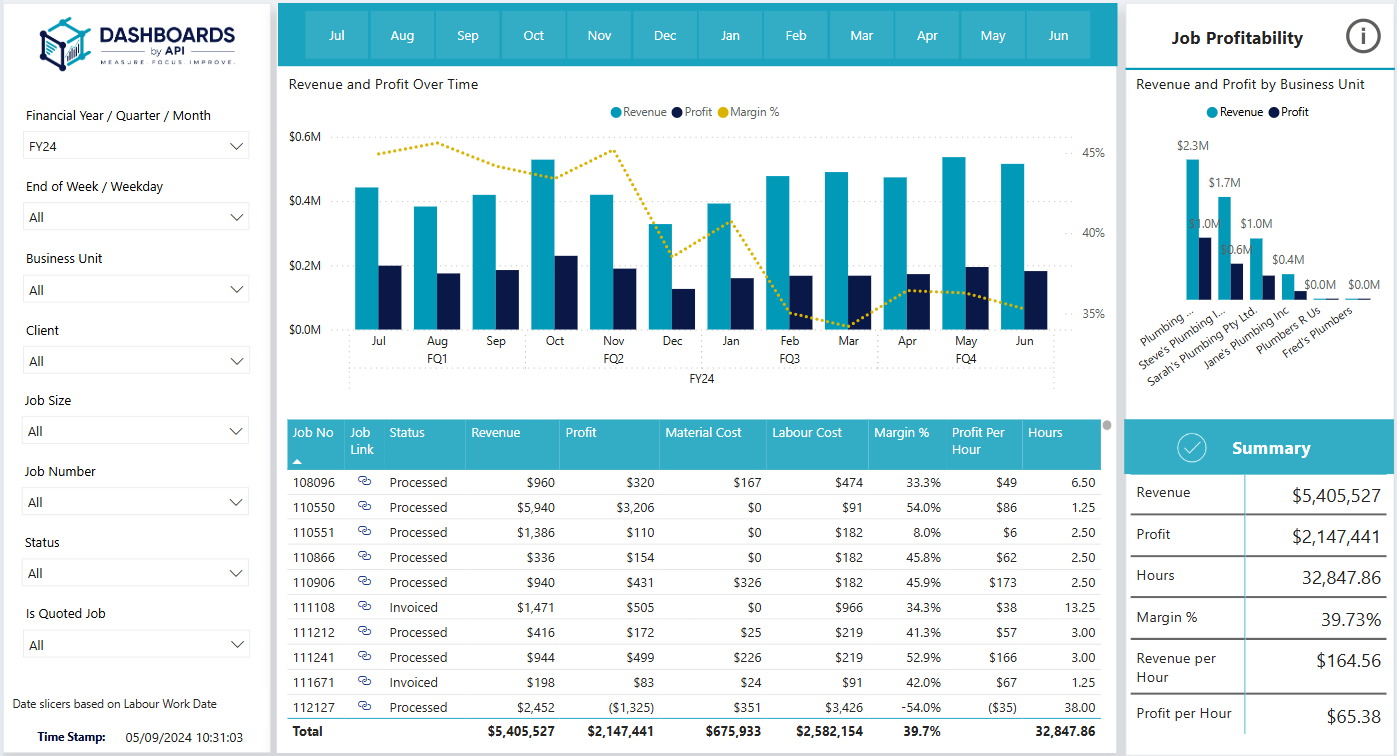
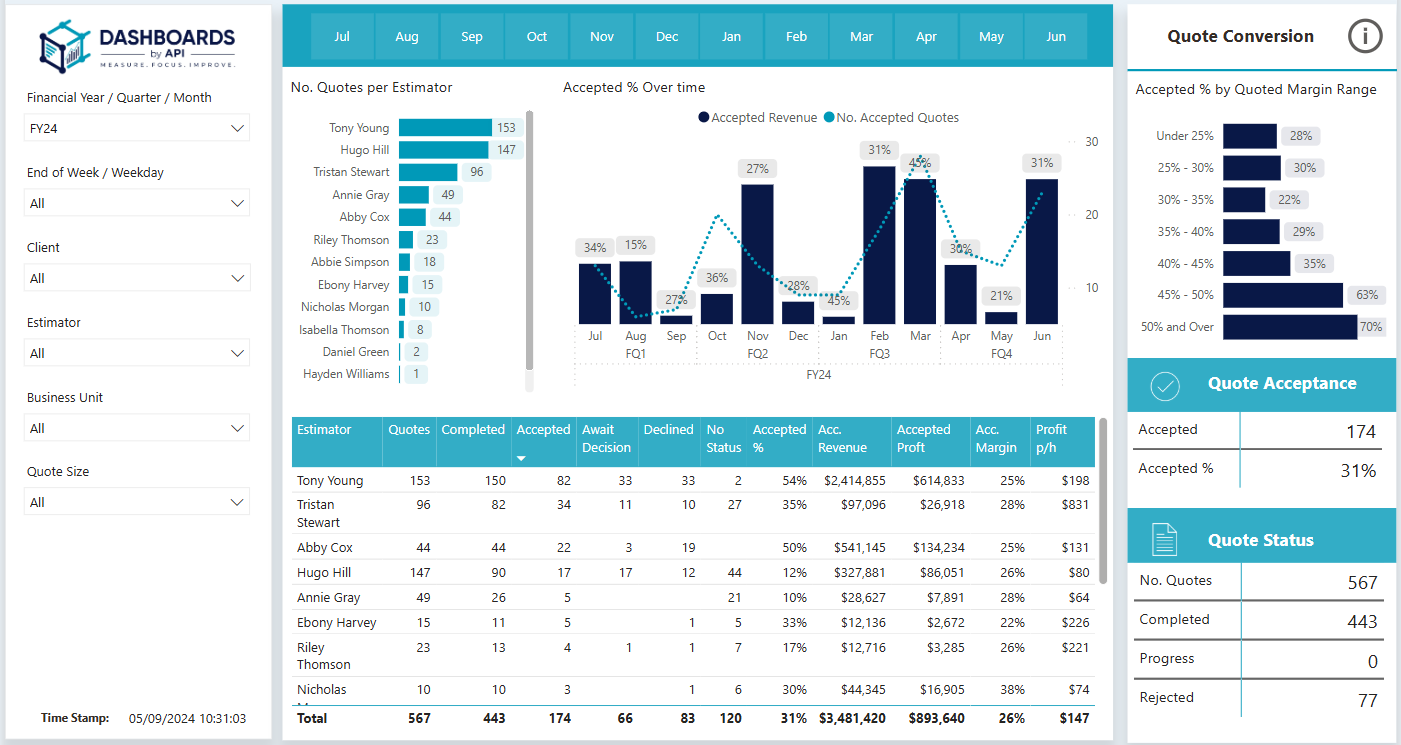
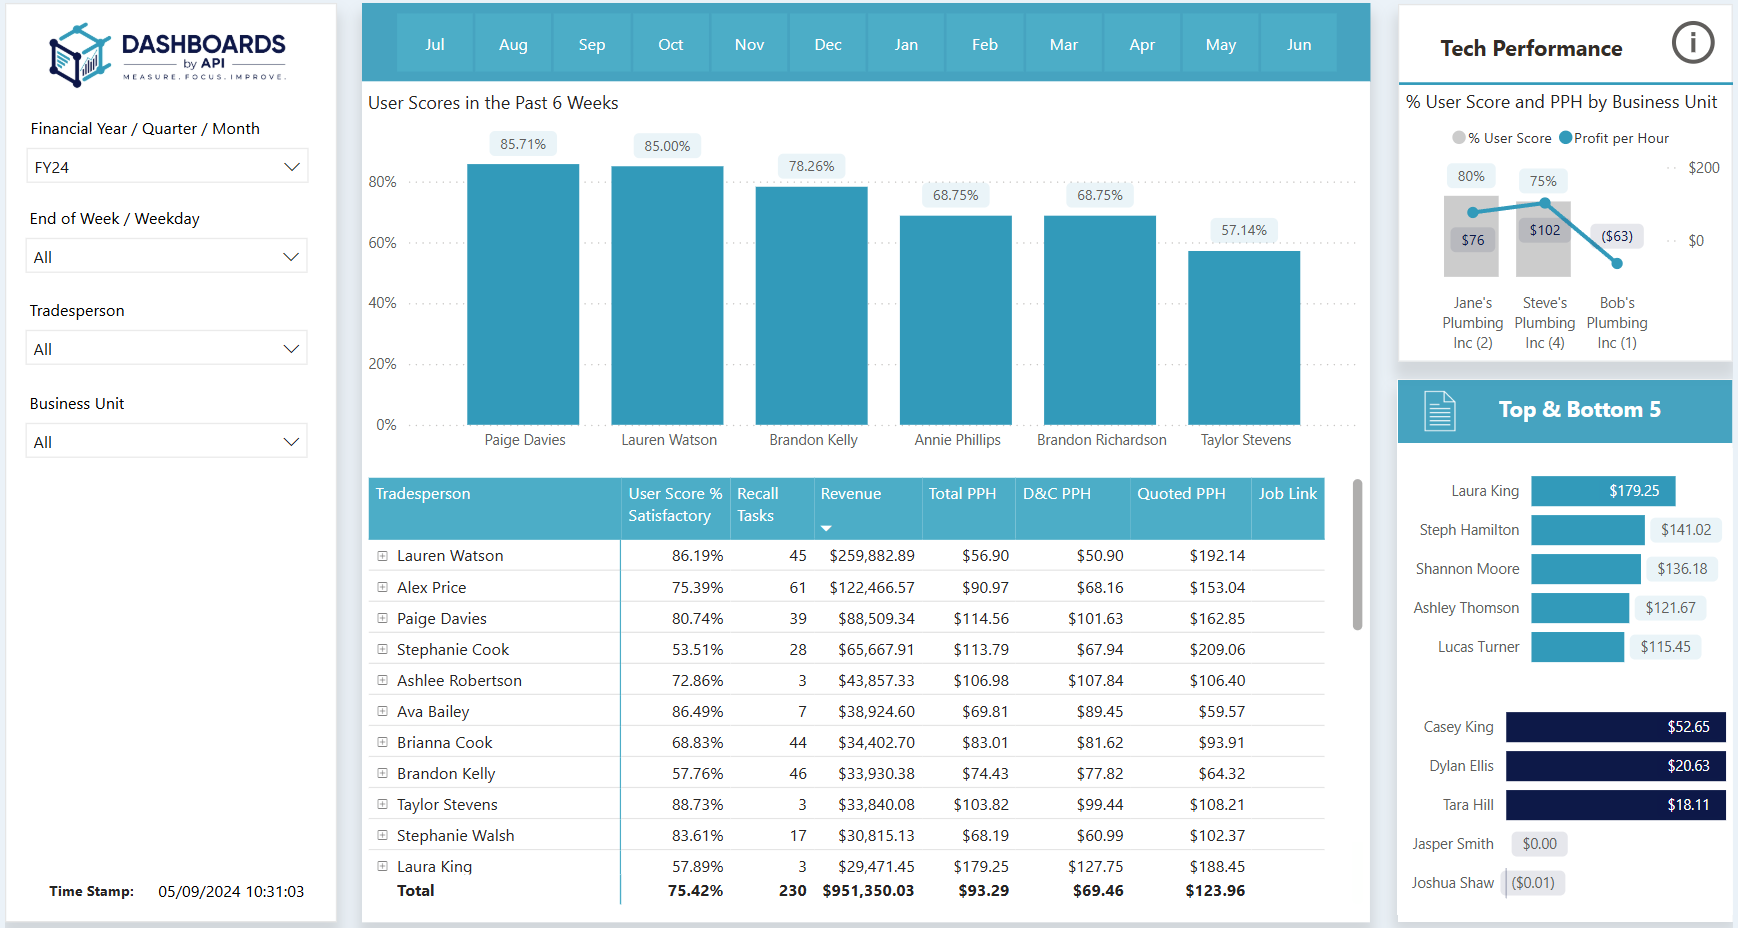
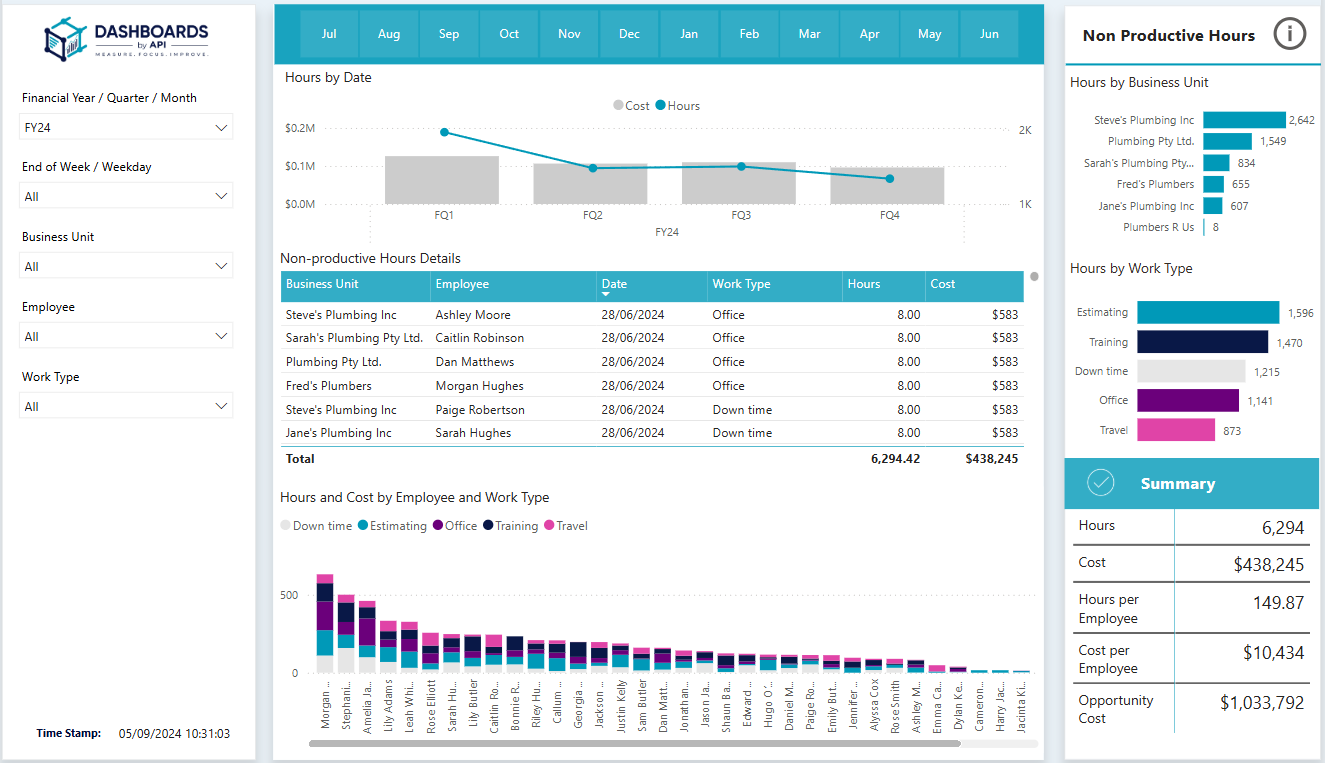
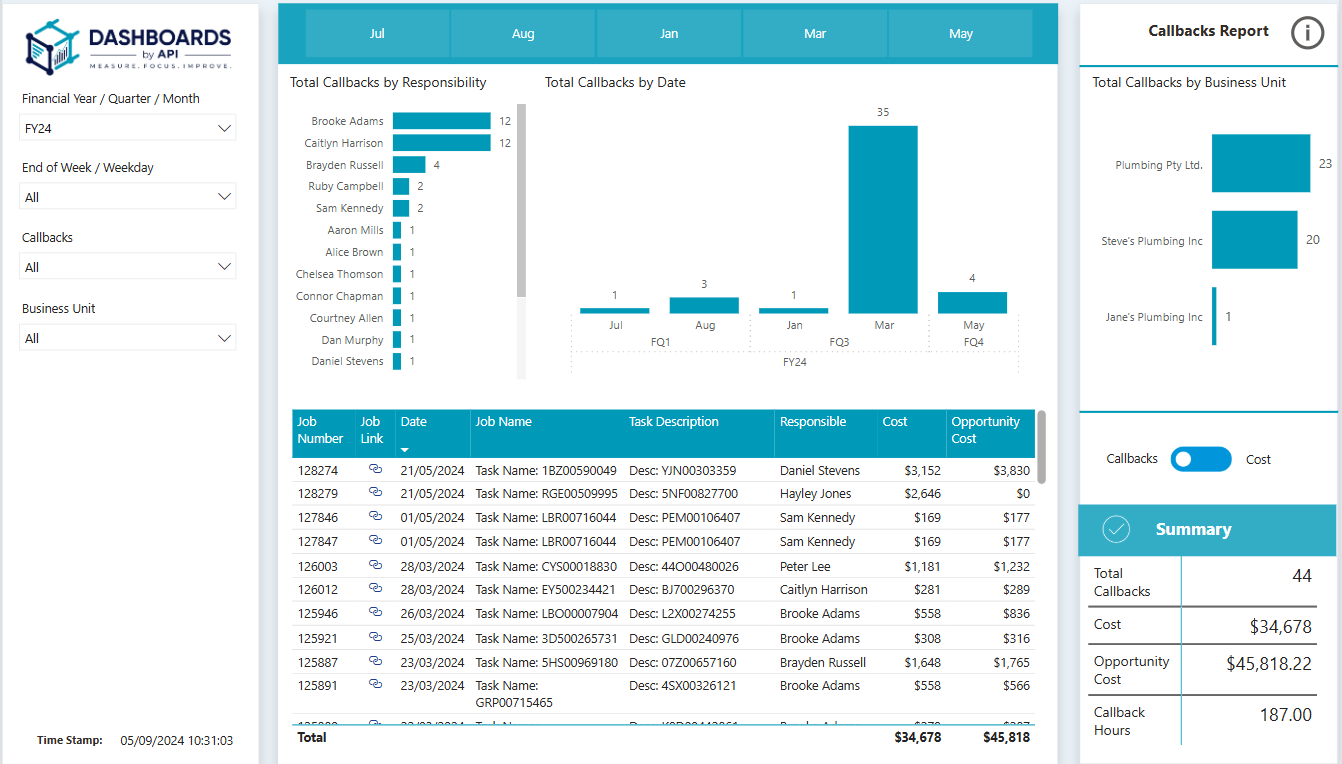
Understand Your True Profitability

Make every hour count. Understand exactly how much profit each hour of work generates, allowing you to optimise processes and maximise your earnings. Our platform reveals your Profit Per Hour for every job, activity, and tradie.

Non-Productive Hours

Don't Let Time Slip Away Unnoticed

Clearly Identify Non-Productive Hours and Understand Where Time Isn't Earning You Money. Our platform highlights Non-Productive Hours, so you can optimise workflows and maximise staff utilisation.

Un-invoiced Tasks

Improve Cash Flow Instantly

Don’t Leave Money on the Table. Clearly Identify Un-invoiced Tasks and Take Control of Your Cash Flow. See Every Un-invoiced Task and Ensure You Get Paid for All Completed Work.

Compare Quotes vs. Actual

Unlock Powerful Performance Insights

The Ultimate Quote vs Actual Solution: Gain Unparalleled Visibility Into Job Costs vs Estimates, Empowering You to Make Smarter Choices and Drive Profitability. Pinpoint Issues with Estimating or Execution to Make Data-Driven Decisions and Boost Your Bottom Line.

Client Profitability

Identify Your Most Valuable Clients

Analyse Client Profitability to Understand Your Strengths, Find Your Niche, and Drive Sustainable Growth. Identify Your Ideal Clients and Most Profitable Services to Refine Your Focus and Increase Earnings.

Quote Conversion Rates

Optimise Your Sales Success

Understand Who's Converting Quotes and Which Ones Are Most Profitable to Refine Your Approach and Increase Success. See Exactly Which Quotes Are Converting and Delivering the Highest Profits to Optimise Your Sales Process.

Daily Refresh of Data

act on the here and now

Your data updates daily—so you can spot issues fast, jump on opportunities, and steer your business in real time.

Inspire your team with results they can see

Fair, transparent, and data-backed

Cut out the guesswork. Let the data speak for itself when it comes to technician performance—use it to reward effort, back up pay decisions, and motivate your team.

One company

One Dashboards by API client increased their Profit Per Hour per Technician by $38.05. Use the caluclator below to mess with the numbers for your business. Typically our clients see a PPH increse of $7 - $25.


Annual NET Profit Increase: $0

*Based on a 37.5 hour working week, 44 weeks a year.

Dashboards PRO

A streamlined set of 8 essential reports for trade businesses, designed for users of AroFlo and SimPRO job management software.

Simple, plug-and-play insights to help you stay on top of the numbers that matter most. Data Refresh Frequency Data is refreshed overnight for daily insights.

Want to go beyond PRO? Chat to us on how we can customise reports to your exact needs.

Un-Invoiced tasks / jobs

Ensure all completed work is billed. Boost cash flow.

Job Profitability

See if your jobs are making money. Protect your margins.

Quote Vs. Actual​

Check if your quotes match reality. Stop underquoting.

Revenue Matrix

Identify your top services and clients. Focus on what’s profitable.

Quote Conversion

Track who’s winning the most work and to who. Improve sales success.

Technician Performance​

See which team members are excelling. Reward top performers.

Non-Productive Hours

Find and fix wasted time. Reduce labor costs.

Callbacks

Spot costly rework and quality issues. Cut down on do-overs.

Ready to See Dashboards by API in Action?

systemstodashboard